

It’s hard to walk around Washington, D.C. without stepping on a think tank. One estimate is that Washington has over 400 think tanks and that there are almost 2,000 nationwide. Some have a partial rural focus (The Aspen Institute and Brookings Institution, for example) – most do not. Most are nonprofits, but federal agencies also have research divisions such as the Economic Research Service at USDA.
A newer and smaller but very interesting nonprofit think tank is the Economic Innovation Group (EIG). Several tech and financial leaders founded the organization in 2015.
According to their site, EIG is a “…bipartisan public policy organization that combines innovative research and data-driven advocacy to address America’s most pressing economic challenges.” EIG also claims to be “A national leader in bringing geographic inequality into the national conversation.”
Very recently EIG began a research series on rural America. In “Redefining Rural,” a paper written by Kennedy O’Dell and published March 9, EIG found that rural places in the US mostly lag behind non-rural places on almost all measures of economic health and prosperity. Major findings were:
• The average poverty rate in rural areas is nearly three percentage points higher than in non-rural areas. The biggest gap between rural and non-rural welfare is in the South.
• From 2014 to 2018, 43.4% of rural counties experienced negative employment growth compared with just 16.5% of non-rural counties.
• 91% of rural counties saw a decline in their prime working-age population from 2010 to 2019. Over half lost 10% or more.
• The biggest age cohort in rural America is 55-64, compared to 25-34 in non-rural areas.
• Economically distressed counties are home to more than half of rural Black residents and 45% of rural Native American residents, but only 18% of rural whites.
• Rural counties with a recreation focus are usually the most prosperous. One in four rural counties that are the most prosperous is recreation-dependent.
Distressed Communities Index
Perhaps EIG’s most useful and innovative tool is the annual Distressed Communities Index. The fourth edition of the Index came out in October 2020. The DCI looks at every zip code in the US and considered the following percentages:
- The population 25 years old and older that lacks a high school diploma or the equivalent.
- Unoccupied habitable housing, except for seasonal and recreational properties.
- The population ages 25-54 population that are not currently employed.
- The population living under the poverty line.
- Median household income as a ratio or percent of metro area median household income (or state, for non-metro areas).
- The change in the number of jobs from 2014 to 2018.
- The change in the number of business establishments from 2014 to 2018.
With that data in hand, communities are ranked in five quintiles: distressed, at-risk, mid-tier, comfortable, or prosperous.
The latest DCI’s section on rural America stated that “Many small towns and rural areas have experienced relative decline since 2000. Relative to the rest of the nation, economic well-being has ebbed for small towns and rural areas since the turn of the century. The number of rural zip codes decreased nationally by 6.8% from the 2000 [Distressed Communities Index] to the 2020 DCI as the country grew and sprawled…The population living in distressed rural zip codes increased by 12.7% as more rural zip codes fell into the bottom tier, symbolizing the loss in relative economic standing many rural areas have suffered this century.”
According to the report, the economically struggling areas are concentrated in the South, totaling two-thirds of the country’s distressed zip codes and 44% of “at-risk” rural zip codes.
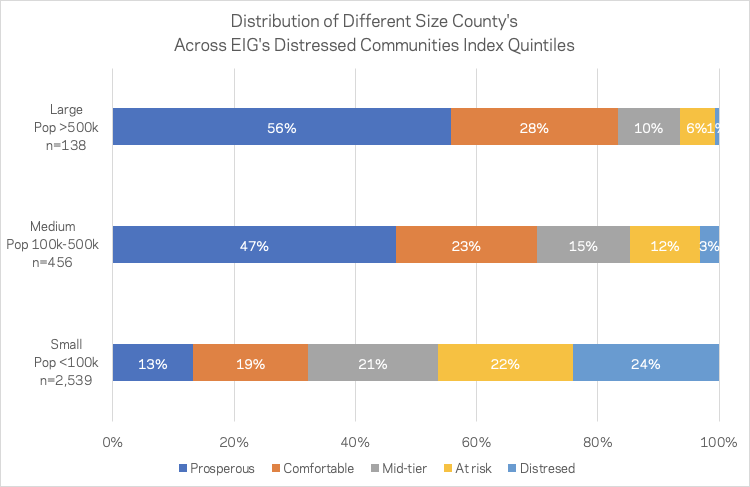
The 2020 DCI also includes the table below, showing some very stark differences by county size. The table shows that 56 percent of large counties and 47% of medium-size counties – but only 13% of small counties (less than 100,000 population) — are prosperous. One percent of large and three percent of medium counties, but 24% of small counties, are distressed. Overall 46% of small – but only seven percent of large and 15% of medium – counties are either at risk or distressed.
The 2020 DCI found that:
● 50.5 million US residents live in economically distressed communities. These zip codes scoring worst on the Index have 16% of the population and an average poverty rate of 24.8%.
● 82.4 million people live in prosperous communities. This one-fifth scoring highest on the DCI has 26% of the population and an average poverty rate of 5.7%.
● Mississippi has the highest percentage of people living in distressed zip codes and is one of six states, including Alabama, Kentucky, Louisiana, New Mexico, and West Virginia, in which more than a third of the population lives in a distressed zip code.
● The five states with the highest percentage of people living in prosperous zip codes are New Hampshire, Colorado, Utah, Minnesota, and Massachusetts. In all five, more than 40 percent of the population lives in a prosperous zip code.
● In prosperous zip codes, 47.2% of adults have obtained at least a college degree. By contrast, 56% of adults in distressed zip codes have only a high school diploma or less. Prosperous zip codes now contain roughly 40% of the country’s college-educated population, compared to 26% of the total population. The average prosperous community has more adults with an advanced degree than the average distressed community has adults with a college degree or higher.
● Prosperous communities are overwhelmingly suburban in nature. Over 61% of the population in this quintile lives in a suburban zip code.
● Over half of all counties with over 500,000 people are prosperous, compared to only 13% of counties with under 100,000 people. Among the smallest counties, 22% are at risk and 24% are distressed. But among large counties, sic percent are at risk and one percent are distressed.
An especially useful tool in the DCI report for 2020 is its interactive map. This map allows a user to call up data by zip code, county, state, and Congressional district. Some areas are not included due to very low populations. EIG has also proposed the idea of a “Heartland Visa” to allow skilled immigrants to reside in areas that are losing population regularly or stagnating.
EIG’s staff also points out that the center of gravity of American prosperity has shifted to the Northwest and towards big cities since 2000. Idaho and Montana join Washington and Oregon with some of the most significant improvements on the DCI index. Elsewhere, large states with large cities such as California and Texas, and to a lesser extent, New York, also climbed overall, reflecting the major metro dominance of economic growth since the Great Recession and broader city revivals since 2000. Those advances came at the expense of gradual erosions in stature across New England, the Great Lakes, and some rural states.
The 2014-2018 measure – the focus of the latest DCI – does not take account of the recent pandemic. EIG plans to skip a year of the DCI, providing a better analysis of the pandemic’s impact in two years.
![]()
